
Monday, December 31, 2007
Wall Street Survivor Contest
The Wall Street Survivor contest is starting up again on January 2nd with over $50,000 in prizes. It is free to play. Sign up to play now. FREE TO PLAY - Fantasy Stock Trading Challenge

Saturday, December 29, 2007
Citi: Some quick math
Analysts warned this week that Citi may need to right off another $18.7 billion in the fourth quarter, exceeding earlier estimates of $8 to $11 billion. The actual total may be even greater than this based on some simple math. Citi holds some $43 billion in CDOs with subprime mortgages underlying them. At this point, these derivatives are trading best case for 43 cents on the dollar; many are down near 22 cents on the dollar. A simple calculation of 57% of $43B shows that $24.5 billion of bad CDO investments will still need to be written down. Not all of this will occur in the fourth quarter, but to properly mark the books to market the greater part of it must.
The totals may even be worse, Citi has an additional exposure of $12 billion to subprime that is non-CDO. Additionally the bank will be fortunate to hit a peak salvage value of 43 cents per dollar on these investments; many will go for below 30 cents in the current crunch.
This makes it likely that Citi will need to significantly cut its dividend and seek additional outside investment from sovereign funds to bulk up its capital ratio to regulatory minimums.
The banks are still running red, and the impending credit card meltdown is not included in the tally yet. A number of notable Hedge Fund managers were quoted this week saying that Citi was a buy at $5 per share, a mere 83% tumble from the current share price.
Citi May Write Down $18.7B, Analysts Say
Friday, December 28, 2007
Screening to Win: Bollinger Bands
The overview below describes one of the common technical indicators – Bollinger Bands and provides insights on how to utilize it in your stock selection. Hopefully this outline will provide traditional fundamental investors with some solid insight on how to incorporate technical indicators into their screening. The free HingeFire Stock Screener which can be found at http://www.hingefire.com is one of the few tools available that includes a wide selection of fundamental and technical criteria for selecting stocks. Using a combination of fundamental and technical screening is a powerful tool for winning in the market.
Bollinger Bands
Bollinger Bands Overview
Bollinger Bands were created by John Bollinger in the early 1980s. The intention of Bollinger Bands is to allow the dynamic comparison of volatility and associated price levels over time.
Bollinger Bands are created by taking a 20 day SMA average and then placing two bands, one above and the other below, at two standard deviations away from the central SMA line. These bands are drawn on the same chart as the stock price.
The lower Bollinger band normally marks a support level while the upper band defines resistance. Many times a dropping or rising price level only crosses outside the bands for a single day. In some sense most stocks are not more volatile than the bands associated with Bollinger, any price outside the band is likely to quickly revert to a level inside. One exception are situations in which the equity price is quickly rising and falling, and the bands “open up” as the volatility increases.
The HingeFire tool provides support to incorporate Bollinger Bands in your creation of screens for stocks. Users can scan to find stocks whose prices are at extreme and unsustainable short-term levels. The HingeFire screener can uncover stocks that are outside the upper and lower Bollinger Bands, as well as those where the price has just crossed these levels in either direction.
How to use Bollinger in screening
Most investors utilize the crossovers above the upper Bollinger Band or below the lower Bollinger Band when screening with the indicator. Bollinger crossovers represent volatility extremes, and usually imply that the price will snap back shortly. Many times these serve as excellent short-term entry points when confirmed with other indicators.
Another common method to screen with Bollinger is to scan for stocks that are outside the upper and lower bands. This will catch stocks that have been in these extremes for more than a single day.
Crossing above the upper Bollinger
The upper Bollinger Band serves as a resistance level. Stocks whose prices rise above this level tend to snap back below it, many times in under a single day. This is especially true in situations where the bands do not “open up” due to increased volatility. If the Bollinger Bands remain steady in width then if is likely that the price increase above the upper band is short lived.
AANB (Abigail Adams National Bancorp Inc.) crossed above the upper Bollinger Band. Note that the bands are not widening, but have remained fairly static in width over time. It is likely that this price rise outside the upper band over the $11.62 level will not last. The normal expectation will be for the closing price to drop below the band shortly. To many investors this would serve as an indicator that they should wait before entering long, and only consider a short-term short position as the current price levels.
Crossing below the lower Bollinger
The lower Bollinger Band acts as a support level. Normally when the price of a stock falls below the lower band, it tends to revert back above it. The cross below is of interest because this event many times lasts only a single day and serves as a good long entry point in some situations.
GWR (Genesee & Wyoming Inc.) dropped below the lower Bollinger Band today when the price closed at $24.78. The width of the bands has not changed greatly over the past couple of months after widening after the drop in November. The current drop started in early December starting near the upper band and now possibly ending after crossing the lower band. Assuming the information cross correlates with other technical and fundamental indicators, this may serve as a good entry point for a long investor.
Price above upper Bollinger
Sometimes the price can rise above the upper Bollinger Band for several days before retreating to inside the band. This usually occurs in scenarios where the band rises and widens with the increase in the stock price and volatility.
EEQ (Enbridge Energy Management LLC) rose outside the upper Bollinger Band for several days in early November. The closing prices remained outside the band for five days as the stock price rose and the Bollinger Band widened. Eventually the stock price peaked and reverted below band. Some investors screen for situations where the stock price is above the upper Bollinger Band, pull up the charts, and then implement short trade entries after the price action peaks out.
Price below lower Bollinger
In some situations, the price of a stock can drop below the lower Bollinger Band for several days. This usually occurs in scenarios where the stock price is in free-fall and the band widens to accommodate the increasing volatility. Normally the price will revert inside the band after a few days when the selling momentum dissipates.
A recent scan using the HingeFire tool found that WYE (Wyeth) dropped below its lower Bollinger Band for the past three days. The band has opened up in the direction of the price drop and widened. As with many situations, the recent drop in Wyeth is a news driven event, the market has concerns about potential generic competition with one of it leading patent-protected drugs. Usually these types of news stories only hold the price down for a short period of time. A patient investor would monitor this situation and wait for an opportunity to put on a long position if they believe the fundamentals of the company are sound.
Bollinger Summary
By themselves, Bollinger Bands do not normally generate pristine buy and sell signals. It is best to cross correlate information from Bollinger with other technical indicators before taking action. On a chart, Bollinger Bands are excellent for identifying periods of high and low volatility, as well as extreme pricing levels.
Many investors utilize Bollinger to look for divergences in stock price and the volatility of the bands. A small number of investors try to set different Bollinger periods and standard deviations on charts to match the particular equity under evaluation. However the traditional 20 day Bollinger with two standard deviation bands is normally the best for intermediate term studies.
The HingeFire tool supports users in screening for the following situations with the Bollinger Band indicator:
Bollinger Bands
Bollinger Bands Overview
Bollinger Bands were created by John Bollinger in the early 1980s. The intention of Bollinger Bands is to allow the dynamic comparison of volatility and associated price levels over time.
Bollinger Bands are created by taking a 20 day SMA average and then placing two bands, one above and the other below, at two standard deviations away from the central SMA line. These bands are drawn on the same chart as the stock price.
The lower Bollinger band normally marks a support level while the upper band defines resistance. Many times a dropping or rising price level only crosses outside the bands for a single day. In some sense most stocks are not more volatile than the bands associated with Bollinger, any price outside the band is likely to quickly revert to a level inside. One exception are situations in which the equity price is quickly rising and falling, and the bands “open up” as the volatility increases.
The HingeFire tool
 provides support to incorporate Bollinger Bands in your creation of screens for stocks. Users can scan to find stocks whose prices are at extreme and unsustainable short-term levels. The HingeFire screener can uncover stocks that are outside the upper and lower Bollinger Bands, as well as those where the price has just crossed these levels in either direction.
How to use Bollinger in screening
Most investors utilize the crossovers above the upper Bollinger Band or below the lower Bollinger Band when screening with the indicator. Bollinger crossovers represent volatility extremes, and usually imply that the price will snap back shortly. Many times these serve as excellent short-term entry points when confirmed with other indicators.
Another common method to screen with Bollinger is to scan for stocks that are outside the upper and lower bands. This will catch stocks that have been in these extremes for more than a single day.
Crossing above the upper Bollinger
The upper Bollinger Band serves as a resistance level. Stocks whose prices rise above this level tend to snap back below it, many times in under a single day. This is especially true in situations where the bands do not “open up” due to increased volatility. If the Bollinger Bands remain steady in width then if is likely that the price increase above the upper band is short lived.
AANB (Abigail Adams National Bancorp Inc.)
 crossed above the upper Bollinger Band. Note that the bands are not widening, but have remained fairly static in width over time. It is likely that this price rise outside the upper band over the $11.62 level will not last. The normal expectation will be for the closing price to drop below the band shortly. To many investors this would serve as an indicator that they should wait before entering long, and only consider a short-term short position as the current price levels.
Crossing below the lower Bollinger
The lower Bollinger Band acts as a support level. Normally when the price of a stock falls below the lower band, it tends to revert back above it. The cross below is of interest because this event many times lasts only a single day and serves as a good long entry point in some situations.
GWR (Genesee & Wyoming Inc.)
 dropped below the lower Bollinger Band today when the price closed at $24.78. The width of the bands has not changed greatly over the past couple of months after widening after the drop in November. The current drop started in early December starting near the upper band and now possibly ending after crossing the lower band. Assuming the information cross correlates with other technical and fundamental indicators, this may serve as a good entry point for a long investor.
Price above upper Bollinger
Sometimes the price can rise above the upper Bollinger Band for several days before retreating to inside the band. This usually occurs in scenarios where the band rises and widens with the increase in the stock price and volatility.
EEQ (Enbridge Energy Management LLC)
 rose outside the upper Bollinger Band for several days in early November. The closing prices remained outside the band for five days as the stock price rose and the Bollinger Band widened. Eventually the stock price peaked and reverted below band. Some investors screen for situations where the stock price is above the upper Bollinger Band, pull up the charts, and then implement short trade entries after the price action peaks out.
Price below lower Bollinger
In some situations, the price of a stock can drop below the lower Bollinger Band for several days. This usually occurs in scenarios where the stock price is in free-fall and the band widens to accommodate the increasing volatility. Normally the price will revert inside the band after a few days when the selling momentum dissipates.
A recent scan using the HingeFire tool found that WYE (Wyeth)
 dropped below its lower Bollinger Band for the past three days. The band has opened up in the direction of the price drop and widened. As with many situations, the recent drop in Wyeth is a news driven event, the market has concerns about potential generic competition with one of it leading patent-protected drugs. Usually these types of news stories only hold the price down for a short period of time. A patient investor would monitor this situation and wait for an opportunity to put on a long position if they believe the fundamentals of the company are sound.
Bollinger Summary
By themselves, Bollinger Bands do not normally generate pristine buy and sell signals. It is best to cross correlate information from Bollinger with other technical indicators before taking action. On a chart, Bollinger Bands are excellent for identifying periods of high and low volatility, as well as extreme pricing levels.
Many investors utilize Bollinger to look for divergences in stock price and the volatility of the bands. A small number of investors try to set different Bollinger periods and standard deviations on charts to match the particular equity under evaluation. However the traditional 20 day Bollinger with two standard deviation bands is normally the best for intermediate term studies.
The HingeFire tool supports users in screening for the following situations with the Bollinger Band indicator:
- Crossing above the upper Bollinger.
- Crossing below the lower Bollinger.
- Price above the upper Bollinger.
- Price below the lower Bollinger.
Combining technical indicators such as Bollinger Bands with commonly used fundamental criteria and technical indicators when selecting your investments helps put the market edge in your corner. The Bollinger support in the HingeFire Stock Screener adds a powerful tool that enables the searching for volatility-related extremes which will improve the timing of your market transactions.
Thursday, December 27, 2007
Triangle Housing Bucks National Trend
As of the third quarter, the home prices in the Triangle were up over 7% from the previous year. The final tally for 2007 in the region is expected to be a price rise of at least 5% year over year. While the housing rise has cooled in the most recent quarter, the Triangle area has matched the trend of neighboring Charlotte in bucking the nationwide real estate price drop.
A recent Fortune magazine article predicted that the RTP area housing prices will likely drop 14.7% over the next five years based on rent to price ratios. However there is an expectation that the large number of people moving to the region to take advantage of the strong job market will buoy the local housing picture. Many real estate specialists are expecting 2008 to be flat in the Triangle, but this is still a much better outlook than most metro areas in the nation that are expecting significant drops in the year ahead.
Prices holding up in Triangle
A well deserved fate: SCO
Today the tech industry observed with pleasure as the bankrupt SCO Group announced that it had been delisted from NASDAQ. SCO spent most of its time and energy suing other firms over rights to the UNIX operating system. According to many industry pundits, there never seemed to be any real grounds for the court actions; the suits were widely viewed in the press as an extortion attempt.
In the long run SCO suffered its well deserved fate, and this evening many in Silicon Valley are raising a glass to celebrate the demise of this firm… now listed on the pink sheets as SCOXQ.PK for the grand price of ten cents per share.
SCO Receives Nasdaq Notice Letter
In the long run SCO suffered its well deserved fate, and this evening many in Silicon Valley are raising a glass to celebrate the demise of this firm… now listed on the pink sheets as SCOXQ.PK for the grand price of ten cents per share.
SCO Receives Nasdaq Notice Letter
Holiday Season Retail Update
Despite the long weekend prior the Christmas holiday, retail sales for the overall period only demonstrated growth of 2.8%, well below the modest expectations of 3.6%.
Retailers extended hours and cut prices to draw shoppers in the last week. In many ways the strategy worked; sales for the week surged 18.7% over the extended weekend compared to the year earlier period. For many retail outlets this helped the season turn from hopeless to tolerable.
Some chain stores such as Target announced reductions in expected December sales. Target was expected to grow same-store sales 3 to 5% instead they are seeing a range of -1 to 1%. Specialty retailers fared better, most were able to hit their modest sales figures. However some traditionally strong sales areas such as women’s clothing showed reductions above 5%; while electronics remained solid.
The market was somewhat buoyed by the consumer confidence figures released today, despite global events in Pakistan. The Consumer Confidence Index advanced to 88.6 in December from a revised 87.8 in November; better than the expected reading of 87.0. Retailers took the consumer confidence readings as a positive sign for the post holiday shopping season during which many shoppes use gift cards and hunt for post-holiday bargains. Initial foot traffic data during the past couple of days supports this optimistic picture.
All-in-all it appears that the final figures will show that the retail holiday season trailed expectations, but was not drastically weak. This show of consumer strength in face of falling real estate values, increasing debt, increasing food costs, and increasing fuel costs demonstrate a positive outlook as the economy rolls into 2008.
Monday, December 24, 2007
Happy Holidays to Everyone
I will be taking several days off around the holiday to travel with my family. I want to wish everyone a happy and safe Holiday Season.
Before heading out, I figured would post a brief clip of one of my favorite holiday tunes by BNL & Sarah Mclanchlan.
The complete version can be found at:
http://profile.imeem.com/TwSayY/music/UamTuNPW/sarah_mclachlan_barenaked_ladies_god_rest_ye_merry_gentlem/
when you sign up for an Imeem account.
Best Wishes to All,
- Greg B.
The new subprime: Credit Card delinquencies soar
As expected the issues in the mortgage market have spread to other types of debt. Recent headlines demonstrate a rapid rise in credit card defaults and delinquencies. This is likely to further impact the bottom lines of many banks and cause the tumble of an entire new series of derivative debt.
Credit card trouble soars
Defaults and delinquencies take a worrying jump as the mortgage crisis leaks into the credit card market
http://www.newsobserver.com/print/monday/front/story/846462.html
Credit card trouble soars
Defaults and delinquencies take a worrying jump as the mortgage crisis leaks into the credit card market
http://www.newsobserver.com/print/monday/front/story/846462.html
Sunday, December 23, 2007
Time to Ask for a Reassessment?
For homeowners who purchased at recent peaks, it may be time to ask your local property tax authority for a reassessment. This is especially true for homes in very pricey areas such as Santa Clara County in California, as well as locations where home prices have tumbled greatly such as Florida. Most communities have a different appeals process, the best way to find out how the reassessment procedure works in your area is to call the local government office. A number of homeowners land up saving hundreds if not thousands in property taxes simply by filing some appeals paperwork.
Taxes Are Reassessed in Housing Slump
http://www.nytimes.com/2007/12/23/us/23tax.html?_r=1&th&emc=th&oref=slogin
Taxes Are Reassessed in Housing Slump
http://www.nytimes.com/2007/12/23/us/23tax.html?_r=1&th&emc=th&oref=slogin
Recession Expectations Up
Not a big surprise to many, the number of Americans expecting a recession rose to 43.4% from 40% one month earlier. Although it still appears that over 50% of people are not even paying attention, based on the poll results.
This touches on an interesting CNBC debate the other day. One commentator held the view the media is responsible for the recession because their constant discussion of the “R” word has undermined confidence. He further stated that the talking heads should be banned by the news outlets from discussing the downside of the economy to stop further erosion.
So much for basic American principles and telling people the truth, just wave the magic wand and the recession will magically disappear if the media does not mention it. All the actual underlying causes such as the credit crisis, falling dollar, trade imbalance, reckless consumer spending, bubbled real estate market, and other negative factors… naturally have nothing to do with an impending recession.
Growing number of Americans expect recession: poll
http://www.reuters.com/article/ousiv/idUSN1821436620071219
More: Avoid Foreclosure Scams
Mortgage scams are not only prevalent in rising real estate markets, but are common in falling markets as owners are desperate to avoid foreclosure. Freddie Mac has come out with a video about foreclosure scams that I would urge folks to watch.
Another complete summary of the many different types of mortgage fraud can be found here:
Let Me Count The Ways
http://alamedalearning.com/reality/2007/06/08/let-me-count-the-ways/
I would urge everyone to be knowledgeable and avoid these scams. You don't even have to be financially troubled for solicitations to start arriving via mail and phone for these scams. Know what to look for and ditch the scammers.
Friday, December 21, 2007
Circuit City: A continuing sad saga
Very rarely do you witness analysts asking the CEO to throw in the towel, sell the company, and step down in the quarterly conference call. At Circuit City this is becoming a regular routine.
While sales at nearest competitor Best Buy rose, Circuit City’s sales slipped 3 percent to $2.96 billion from $3.06 billion a year earlier, with sales at stores open at least a year (a closely watched retail metric) falling 5.6 percent. The financial performance did not fare well either despite cutting all those “highly-paid” associates in stores, “losses ballooned to $207.3 million, or $1.26 per share, from $20.4 million, or 12 cents per share, a year ago”.
The management team lead by CEO Philip Schoonover maintains the company is on the right track and said, "We're staying the course on our longer-term strategic initiatives." It appears the master strategy is to turn on the jets and dive towards bankruptcy.
In a further absurdity, Circuit City announced the approval of millions in cash incentives to retain its executives. These are the same executives that canned all the top performers in stores earlier in 2007 and then watched the stock drop 70% since.
“The bonuses didn't sit well with Merrill Lynch analyst Danielle Fox, who questioned whether Circuit City should be focusing on incentives for the people who sell its products in stores.”
It appears to be time to officially place Circuit City on the “death watch” list. Shortly they can join CompUSA in shuttering all the stores and auctioning the remaining inventory.
Circuit City Posts Huge 3Q Loss
Circuit City Posts Wider-Than-Expected 3rd-Quarter Loss, Shares Tumble
http://biz.yahoo.com/ap/071221/earns_circuit_city.html

Thursday, December 20, 2007
The CDO Downdraft
Yesterday the “Muni Bond Dilemma” was discussed; today the other shoe fell. A good number of Muni Bonds are insured by MBIA. Today Fitch downgraded all the bonds insured by MBIA (172,860 municipal, 162 non-muni) to Rating Watch Negative due to its CDO exposure
In a shocking revelation the world’s largest bond insurer, MBIA, disclosed that it guaranteed $8.1 billion of collateralized debt obligations that have significant probability of losses. The analyst community was disturbed that this information has been withheld until now. Especially in view that MBIA may not have adequate capital to cover widespread losses. Other insurers are also being given a critical re-evaluation by rating agencies. Several are stumbling and one in particular, ACA Capital Holdings (ACAH.PK), is on verge of bankruptcy unless a rescue occurs.
MBIA fell 26% to $19.95 today in reaction to the news. A more severe response was given by Fitch with the downgrade of all the Muni-debt backed by MBIA. The instability caused by the CDO exposure of the insurer effectively is hitting the entire Muni Bond market.
There is an increasing probability that one or more of the bond insurers will quickly dive into bankruptcy. The majority of Muni-Bonds enjoy high ratings due to the insurance backing. Failure, due to unrelated CDO guarantees, of the insurance firms that also back the municipal bonds is likely to cause many these government issued bonds to be cut from high ratings to near junk.
Fitch Places 173,022 MBIA-Insured Issues on Rating Watch Negative
http://www.businesswire.com/portal/site/home/index.jsp?epi-content=GENERIC&newsId=20071220006121&ndmHsc=v2*A1198155600000*B1198219069000*DgroupByDate*J1*N1000837&newsLang=en&beanID=202776713&viewID=news_view
MBIA Tumbles on $8.1 Billion of CDOs, Fitch Warning
http://www.bloomberg.com/apps/news?pid=20601087&sid=aF5n2mMwD_VE&refer=home
Ambac, MBIA and rivals may lose AAA ratings: S&P
FGIC's rating also imperiled; ACA Capital ratings slashed to CCC
http://www.marketwatch.com/news/story/sp-warns-may-cut-aaa/story.aspx?guid=%7B13D7F179%2D88E0%2D4995%2DA566%2DB41CC5BBEC5D%7D&siteid=yhoof
Quick Takes: BW labels mortgage CDOs a pyramid scheme
Business Week provides a detailed look at the Bear Stearns’ Hedge Funds which collapsed and outlines their similarities to a pyramid scheme. A good read…
The Bear Flu: How It Spread
A novel financing scheme used by Bear Stearns' hedge funds became a template for subprime disaster.
http://www.businessweek.com/magazine/content/07_53/b4065000402886.htm
“The global markets are dealing with the consequences: The tab from the mortgage mess could run up to $500 billion, and central bankers are struggling to stave off recession. As investigators sort through the wreckage, the records of Bear Stearns' doomed hedge funds are turning out to be some of the most revealing in an era of financial folly.”
How to check out your Stock Broker
Investors can check out the background of their broker at http://www.finra.org/ It is possible to search for brokers and firms, and look at disciplinary actions taken against the broker as well as obtaining status and history information. Investors should look for red flags such as frequent firm changes, work history at firms with excessive complaints, and unexplained disciplinary items. The Financial Industry Regulatory Authority (FINRA) is the largest non-governmental regulator for all securities firms doing business in the United States.
Their direct broker check link can be found at:
http://www.finra.org/InvestorInformation/InvestorProtection/ChecktheBackgroundofYourInvestmentProfessional/index.htm
Their direct broker check link can be found at:
http://www.finra.org/InvestorInformation/InvestorProtection/ChecktheBackgroundofYourInvestmentProfessional/index.htm
Wednesday, December 19, 2007
The Muni Bond dilemma
Many investors include Municipal Bonds as a portion of their portfolio. Muni Bonds have the advantage of being federal and state tax-free while normally delivering solid yields. The overall returns from Muni Bonds crushed Treasury and corporate debt sectors from 2004 to 2006. This year is shaping up to be a different story.
The MBH3 Muni Index and others are trailing the debt market in 2007 as the recent subprime credit crunch raises concerns about agency rating of this debt as well as the ability of bond insurance companies to guarantee the Muni Bonds after all the mortgage derivative losses.
Other headwinds facing Muni Bonds include the pension payment crisis unfolding in many states and communities. Governments have under-funded their pension funds for many years and now the vultures are coming home to roost. Many entities will have difficulty funded current operations and paying retirees. This is coupled with that many local governments have invested their funds in derivative debt pushed by Wall Street and have suffered staggering losses (see Will State SIV Funds bankrupt local communities?). There is also the expectation that reduced consumer confidence will lead to falling revenue for projects financed by communities such as stadiums, museums, and theaters. This is all occurring at a time when many localities are observing faltering tax collections due to foreclosures.
At this point, institutions and hedge funds are not stepping up to purchase Muni Bonds. Hedge fund losses for the year in Muni Bonds have ranged from 5 to 30 percent. The lack of buyers is likely to lead to further losses. This has also caused recent issues offered by state and local governments to pay much higher interest rates in the market.
Even with the recent turmoil, investors should for the most part hold any current Muni-Bonds or Funds in their portfolio for the long term but not make additional purchases. However all bond holders should investigate the principal and interest risk for any individual Muni Bonds in their brokerage accounts and sell those that appear to be at high risk of downgrade or default.
Muni Bonds Swoon With Worst Total Returns Since 1999
http://www.bloomberg.com/apps/news?pid=20601009&sid=aQXkIONsseiw&refer=bond
“The funds are seeking new accounts, but their recent performance was a lot worse than some people thought possible,'' Ratnow said. ``On the positive side, the funds have a history of producing big gains after months with big losses.''
Today's Chart of the Day
Which one are you going to buy - Best Buy or Circuit City?
http://finance.yahoo.com/q/bc?s=BBY&t=1y&l=off&z=m&q=l&c=cc
The Electronics store that continually delivers solid quarters, or the one who cans all of their top performers while their misguided executives do their best to drive it to bankruptcy. The difference could not be more stark.
Strong Sales Boost Best Buy 3Q Profit
http://biz.yahoo.com/ap/071218/earns_best_buy.html?.v=17
Quick Takes: The biggest crisis of the last half century?
We can thank the mortgage industry and the wizards on Wall Street for brewing the huge subprime credit crisis. Smug in their beliefs that real estate values always rise nationwide, people always pay their mortgages, and that generating new finanical vehicles will eliminate risk, a catastrophe has been created. One that will be with us for years probably causing $6T or more in housing wealth to evaporate.
The Wall Street Journal provides their perspective:
U.S. Mortgage Crisis Rivals S&L Meltdown
http://finance.yahoo.com/loans/article/104050/US-Mortgage-Crisis-Rivals-S&L-Meltdown
The Wall Street Journal provides their perspective:
U.S. Mortgage Crisis Rivals S&L Meltdown
http://finance.yahoo.com/loans/article/104050/US-Mortgage-Crisis-Rivals-S&L-Meltdown
Tuesday, December 18, 2007
Avoid Foreclosure Scams
In the current dismal real estate market, there are many foreclosure scams making an appearance. Most of these scams promise homeowners that they can prevent foreclosure if they are late on their payments. The reality is that most of these “plans” are simply scams whose primary purpose is to take advantage of the homeowner and rip them off.
A recent articles came out that provides good information on how to avoid these scams. I would urge anyone facing late payments on their mortgage (or is trying to help someone in this position) to read this article. Even those up to date on their mortgages will benefit from it, especially the advice to watch out for unsolicited letters appearing to be from a division of your mortgage company demanding additional money.
How to Spot a Foreclosure Rescue Scam
http://finance.yahoo.com/expert/article/millionaire/58089
The Derivative House of Cards: The “Shadow Banking” System falters
Traditionally banking was collecting cash, making loans, and selling low-risk bonds. The old-world apparently was run over by the freight train of modern derivative banking. The brave new world of banking is focused on derivative structures, generating fees, and passing risk down the chain. However the recent credit crisis has proven that eventually someone will be left holding the bag as the house of cards crumbles.
The new modern banking system has operated in “the shadows” according to many. The recent credit crisis has exposed the monstrosity as a multi-headed dreaded hydra. Is it time to properly apply regulatory structure to tame this beast?
A recent article in the Financial Times discusses the system of opaque institutions, non-existent regulation, and derivative vehicles which has led to the credit market turmoil.
Out of the shadows: How banking's secret system broke down
http://biz.yahoo.com/ft/071216/fto121620071354448683.html?.v=1
"What we are witnessing is essentially the breakdown of our modern-day banking system, a complex of leveraged lending [that is] so hard to understand," Bill Gross, head of Pimco asset management group recently wrote. "Colleagues call it the 'shadow banking system' because it has lain hidden for years, untouched by regulation yet free to magically and mystically create and then package subprime loans in [ways] that only Wall Street wizards could explain."
Monday, December 17, 2007
Retailers – A Bleak Season
Recent reports highlight the drop in retail sales across many sectors. Now that surveys are coming out that provide hard data on sales rather than simply projections from foot traffic, the picture is getting bleak. Resembling the recent blizzards sweeping across a good portion of the U.S, an unpleasant freeze has settled in place at the storefronts. U.S. retailers may see the worst sales growth this holiday season since 2002.
The MasterCard sales information demonstrates that focal niches have suffered drops in sales. The widely-watched women’s apparel segment endured a 6% drop in sales during the first half of the holiday shopping season. Most other brick and mortar retailing segments have not demonstrated strength either. Leading the pack were electronics, up 5.8% and luxury items, up 10.8%.
While online sales have surged 18% to $22.7 billion, this increase is a record low. Many online retailers have expressed disappointment about holiday sales.
A mere few days are left as retailers scramble to drop prices hoping to provide shoppers with an incentive to increase their purchases. Some view that this final week will serve as a desperate bid to salvage the holiday season; only time will tell if the merchants pull it off.
Overall it is difficult to find any promising stocks in the retail sector when taking in account fading consumer confidence, increasing credit card defaults, tightened lending, and sputtering holiday sales.
Retailers Face an Ominous Holiday Sign
http://www.nytimes.com/2007/12/17/business/17retail.html?_r=2&ref=business&oref=slogin&oref=slogin
Online sales disappointing
http://www.latimes.com/business/la-fi-internet17dec17,1,1730435.story?coll=la-headlines-business&ctrack=2&cset=true
See the earlier HingeFire post about retail sales:
Can Retail Sales hold up in December
http://hingefire.blogspot.com/2007/12/can-retail-sales-hold-up-in-december.html
Circuit City makes 101 Dumbest Moments List
Circuit City makes number 70 on the 101 Dumbest Moments in Business list... sometimes the citation says it all.
70. Circuit City
Good job. You're all fired.
"In a cost-cutting move, Circuit City lays off all sales associates paid 51 cents or more per hour above an "established pay range" - essentially firing 3,400 of its top performers in one fell swoop. Over the next eight months Circuit City's share price drops by almost 70%."
http://money.cnn.com/galleries/2007/fortune/0712/gallery.101_dumbest.fortune/70.html
See the earlier HingeFire post about Circuit City:
Retro: The Dumbest Retail Business Move of 2007
http://hingefire.blogspot.com/2007/11/retro-dumbest-retail-business-move-of.html
Never has a retailer deserved bankruptcy so desperately!
Sunday, December 16, 2007
Goldman Sachs: A windfall, but at what cost?
To many, Goldman Sachs defines the term “Chutzpah”. While some investors admire the power house bank for avoiding the mortgage fiasco by effectively going short subprime debt; others question the integrity of a firm pimping these structured assets as great investments to customers while simultaneously shorting the entire market with its own capital. A common place duplicity which highlights the misbehavior of Wall Street in the minds of many regulators and industry analysts.
“Goldman's success at wringing profits out of the subprime fiasco, however, raises questions about how the firm balances its responsibilities to its shareholders and to its clients.”
“Why did Goldman continue to peddle CDOs to customers early this year while its own traders were betting that CDO values would fall? A spokesman for Goldman Sachs declined to comment on the issue.”
A recent article gives an excellent overview of the structured products trading group that saved Goldman’s bacon.
How Goldman Won Big On Mortgage Meltdown
Charitable Accounts: Giving Back to the Community
I have always been an advocate for giving back to the community. There are many ways to get involved from giving money to volunteering time.
One of the more difficult aspects of donating money to many different charities is the tracking and book-keeping involved in giving. Setting up a charitable foundation for giving is expensive and time consuming. Now there is a better alternative.
Several major brokerage firms and community foundations now offer donor-advised funds often called charitable checking accounts. These accounts help disperse the funds and minimize the administrative headaches while enhancing your tax deduction reporting for the current year.
The donor-advised accounts can be set up to give cash, stock, or other assets to multiple charities. There are benefits to funding these types of accounts with appreciated stock; it allows the contributor to avoid large capital gain taxes on equities whose price has greatly appreciated. Currently, most contributors fund these accounts with non-cash assets.
Major brokerages such as Schwab and Fidelity support donor-advised funds often for minimums as small as $5000; the fund sponsors handle all of the administrative, legal, and accounting requirements for you.
One recent article provided a good summary of charitable donor-advised accounts.
'Charitable Checking Accounts' Make Giving Easy
http://finance.yahoo.com/expert/article/moneyhappy/55741;
Friday, December 14, 2007
Quick Takes: Greenspan says Odds of recession 'rising'
Confirming what many other economists have outlined lately.....
Greenspan: Odds of recession 'rising'
http://www.chicagotribune.com/business/chi-fri_greenspan_1214dec14,0,1659270.story
WASHINGTON - Former Federal Reserve Chairman Alan Greenspan said the odds the U.S. will fall into a recession are "clearly rising," and he believes economic growth is "getting close to stall speed."
Where is the Real Estate Bottom?
Most falling real estate markets follow a standard historical pattern. The first year is the year of the slide, while the bottom is established during the second year. Clearly 2007 established itself as the year of the slide which means the bottom for most local markets should occur in 2008.
This is good news for many homeowners; if they can just make it through 2008 then they are likely to start seeing their home prices increase in 2009. However for owners that must sell during the upcoming year, the real estate market experience is likely to be even more painful than those who are marketing their homes today.
A good number of seasoned real estate investors are hunting for the market bottom; many expect to find it during 2008 and start purchasing select properties at low prices. However these types of experts represent a minority of the overall set of speculators, but they normally serve as a great benchmark for establishing the market trough. When homeowners start seeing articles in the press highlighting these type of investors than they can start to fell more comfortable about their real estate prospects. Nonetheless owners should understand that the recovery from the bottom is normally slow and requires many years. Usually it takes eight years for a real estate market to recover to its pre-collapse prices; which is still bad news for those who purchased at the peak.
Will Home Prices Hit Bottom in 2008? Yes, But . . .
http://finance.yahoo.com/real-estate/article/104024/Will-Home-Prices-Hit-Bottom-in-2008-Yes-But
Thursday, December 13, 2007
Can Retail Sales hold up in December?
Despite a solid start on Black Friday, there are concerns if the retail sector can put in a solid December. The recent SpendingPulse survey shows that November sales increased by 0.8%. Some sectors are weak, sales of automobiles and home furnishings are off.
The sales in November did not last through the end of the month, leaving many in limbo about expectations for December in the retail sector. Only time will tell, if the American shopper -- already burdened with record debt -- will put retail sales in the plus column. Any way you shuffle the market deck; this is not the time to be rushing off to purchase retail stocks.
Retail season off to solid start: SpendingPulse
http://www.reuters.com/article/ousiv/idUSN1040366620071212
Some Humor: Project Head Honcho
Project Head Honcho: The Citigroup CEO Search
A video on YouTube provides Citi some help with their CEO search:
A video on YouTube provides Citi some help with their CEO search:
IT Financial Sector Spending: The Future is Bright
Brief commentary in the recent Cisco (CSCO) conference call held in early November touched on the possibility of slowing IT spending in the financial sector looking into 2008. Even raising the specter of a reduction in financial IT spending caused the network equipment maker’s stock to slump immediately below $30.
Fortunately for Cisco the reality of financial sector IT spending appears to be much brighter. A survey by Wall Street & Technology and associated firms show that spending on equipment and labor will increase moving forward into 2008. Within the securities industry, nearly half of sell-side firms expect to increase their IT budgets from 11 to 30 percent in 2008. A similar situation in exists at buy side firms with more than a third planning to increase spending by 11 to 30 percent.
The banking sector demonstrates similar results with mid-sized banks leading the sector in spending increases. A good portion of spending by banks is driven by regulatory and compliance requirements while enhancing infrastructure maintenance.
Security still remains near the top of the list across the financial industry in terms of being an area where spending will continue to increase significantly. However there are bright spots in the report for core equipment manufacturers; data center infrastructure will be the focus of the majority of 2008 IT dollars at 82 percent of brokerage firms.
The survey shows an overall increase of more than 10% across the financial sector, rather than any type of decrease in spending. Certainly the picture is brighter than projected by many pundits watching the recent credit turmoil; maybe they need to go buy some shades to improve their vision during the sunny days ahead.
2008 IT Budgets Up More Than 10% for Financial Services Firms
http://www.wallstreetandtech.com/showArticle.jhtml;?articleID=204204039
Wednesday, December 12, 2007
WaMu on the chopping block: Can JPMorgan Chase really turn this bank around?
It was just a matter of time before banks started showing up on the auction block. The latest round of industry press indicates that WaMu may be the most likely candidate. There appears to be some synergy for JPM in this proposed scenario and it comes at a time where WaMu is running out of options. If JPMorgan Chase can actually turn Washington Mutual around this may come off as one of the better acquisitions in recent memory in terms of reasonable valuation.
Ahead of the Bell: JPMorgan Chase
Analyst Says JPMorgan Chase in Position to Make Major Acquisition in the Near Future
http://biz.yahoo.com/ap/071211/ahead_of_the_bell_jpmorgan_chase.html?.v=2
Ahead of the Bell: JPMorgan Chase
Analyst Says JPMorgan Chase in Position to Make Major Acquisition in the Near Future
http://biz.yahoo.com/ap/071211/ahead_of_the_bell_jpmorgan_chase.html?.v=2
Tuesday, December 11, 2007
Screening to Win: Williams %R
The overview below describes one of the common technical indicators – Williams %R and provides insights on how to utilize it in your stock selection. Hopefully this outline will provide traditional fundamental investors with some solid insight on how to incorporate technical indicators into their screening. The free HingeFire Stock Screener which can be found at http://www.hingefire.com is one of the few tools available that includes a wide selection of fundamental and technical criteria for selecting stocks. Using a combination of fundamental and technical screening is a powerful tool for winning in the market.
Williams %R
Williams %R Overview
The Williams %R was created by Larry Williams, and is useful for identifying overbought and oversold conditions in the market. The indicator shows the relationship of the current close in relation to the high-low range over a fourteen day period of time
Values above 80 are considered oversold while values below 20 are considered overbought. Note that this is the exact opposite of most oscillators that utilize a scale of 0 to 100.
The Williams %R Indicator is normally plotted inversely with 100 at the bottom and 0 at the top of the vertical axis. This is reverse of most oscillator graphs. Some charts present the indicator as running from -100 to 0
By the nature of its formation, the Williams %R indicator is generally quite choppy and active. Many times it will provide false signals, which is why investors should look for confirmation from charts or other indicators before entering a transaction.
The HingeFire tool provides support to incorporate Williams %R in your creation of screens for stocks. Users can scan to determine if the Williams indicator is greater than or less than the key 20 (overbought) and 80 (oversold) levels, and also establish if the Williams %R value has just crossed above (JCA) or below (JCB) these thresholds.
How to use Williams %R in screening
Most investors utilize the crossovers from Overbought and Oversold conditions when screening with the Williams %R indicator. Unlike other oscillators, many times crossing into an extreme is of interest rather then just crossing out of it.
Many times the Williams indicator demonstrates price pressure on the edge of an extreme leading to a cycle of higher or lower prices in the direction of the prevailing trend for the period of time. This leads investors to screen for just crossing into extremes below 20 (overbought) or above 80 (oversold); as well as crossing out of these conditions.
Crossing into oversold
Stocks crossing above 80 are considered oversold with Williams %R. Many stocks cross above this threshold and continue in the direction of the prevailing trend for considerable periods of time. Many investors correlate the cross into oversold territory with other technical indicators and use the combination to gauge short-term price momentum.
MFRI (MFRI Inc.) recently crossed again into oversold territory under 80 (plotted at the bottom). The previous cross into oversold territory on October 22nd led to a significant slide in the price of the stock over several weeks. The recent crossover could be setting the table for a similar occurrence.
Crossing into overbought
Stocks crossing below the 20 threshold are considered overbought in the Williams %R indicator. Many times crossing below this level can be a sign that the price increases may continue for a several week period of time; therefore many investors screen for this occurrence.
A fairly volatile stock APFC (American Pacific Corp.) had recently crossed below the 20 level placing it in overbought territory. The earlier cross below this level at the beginning of October demonstrates that this can many times herald the start of a short-term period of price increases while Williams %R remains below the 20 threshold (plotted at the top)
Crossing out of oversold
Many times excellent opportunities exist when the Williams %R indicator crossed below the 80 threshold indicating the stock is not longer oversold. Most traders correlate this change with other technical indicators to confirm the new trend. Some investors wait until the Williams oscillator crosses the 50 mark before acting on a trend reversal. The Williams %R indicator is choppy by nature and can easily reverse after crossing below extremes which is why it is important to wait for the new trend to develop.
A recent HingeFire screen found that DRIV (Digital River Inc) has just crossed below the 80 level exiting the oversold condition. Correlation with other indicators may indicate that the new trend of increasing prices rising is likely to remain in place for several weeks.
Crossing out of overbought
Another trend reversal scenario occurs when the Williams %R indicator crossed above the 20 level indicating the stock is no longer overbought. Correlation with other technical indicators often indicates opportunities where the price is likely to continue to drop in price over a several week period. This can enable investors to time solid entry points at short term troughs in price or look at shorting scenarios.
FUQI (Fuqi International Inc.)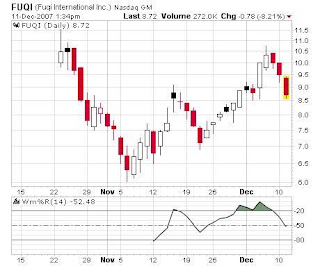 held its IPO in November. Since this time the stock has traded in a range of $6 to $11.50. Recently the Williams %R crossed above the 20 threshold exiting the overbought condition. Since this time the price of the stock has dropped by more then two dollars.
Williams Summary
Williams is similar to the stochastic indicator, however the 14 days Williams %R tends to be more choppy. This leads at times to false signals regarding trend reversals and breakouts; on the positive side the Williams indicator tends to be quick and does not lag greatly. This all gets back to a regular theoretical discussion regarding signal quality versus speed. Overall, it is important to use other technical indicators to confirm the action in the Williams %R before performing transactions.
Many investors use a 28 day version of Williams %R in charts for a smoother version with less false alerts.
The HingeFire tool supports users in screening for the following essential situations with the Williams %R Indicator:
Williams %R
Williams %R Overview
The Williams %R was created by Larry Williams, and is useful for identifying overbought and oversold conditions in the market. The indicator shows the relationship of the current close in relation to the high-low range over a fourteen day period of time
Values above 80 are considered oversold while values below 20 are considered overbought. Note that this is the exact opposite of most oscillators that utilize a scale of 0 to 100.
The Williams %R Indicator is normally plotted inversely with 100 at the bottom and 0 at the top of the vertical axis. This is reverse of most oscillator graphs. Some charts present the indicator as running from -100 to 0
By the nature of its formation, the Williams %R indicator is generally quite choppy and active. Many times it will provide false signals, which is why investors should look for confirmation from charts or other indicators before entering a transaction.
The HingeFire tool
 provides support to incorporate Williams %R in your creation of screens for stocks. Users can scan to determine if the Williams indicator is greater than or less than the key 20 (overbought) and 80 (oversold) levels, and also establish if the Williams %R value has just crossed above (JCA) or below (JCB) these thresholds.
How to use Williams %R in screening
Most investors utilize the crossovers from Overbought and Oversold conditions when screening with the Williams %R indicator. Unlike other oscillators, many times crossing into an extreme is of interest rather then just crossing out of it.
Many times the Williams indicator demonstrates price pressure on the edge of an extreme leading to a cycle of higher or lower prices in the direction of the prevailing trend for the period of time. This leads investors to screen for just crossing into extremes below 20 (overbought) or above 80 (oversold); as well as crossing out of these conditions.
Crossing into oversold
Stocks crossing above 80 are considered oversold with Williams %R. Many stocks cross above this threshold and continue in the direction of the prevailing trend for considerable periods of time. Many investors correlate the cross into oversold territory with other technical indicators and use the combination to gauge short-term price momentum.
MFRI (MFRI Inc.)
 recently crossed again into oversold territory under 80 (plotted at the bottom). The previous cross into oversold territory on October 22nd led to a significant slide in the price of the stock over several weeks. The recent crossover could be setting the table for a similar occurrence.
Crossing into overbought
Stocks crossing below the 20 threshold are considered overbought in the Williams %R indicator. Many times crossing below this level can be a sign that the price increases may continue for a several week period of time; therefore many investors screen for this occurrence.
A fairly volatile stock APFC (American Pacific Corp.)
 had recently crossed below the 20 level placing it in overbought territory. The earlier cross below this level at the beginning of October demonstrates that this can many times herald the start of a short-term period of price increases while Williams %R remains below the 20 threshold (plotted at the top)
Crossing out of oversold
Many times excellent opportunities exist when the Williams %R indicator crossed below the 80 threshold indicating the stock is not longer oversold. Most traders correlate this change with other technical indicators to confirm the new trend. Some investors wait until the Williams oscillator crosses the 50 mark before acting on a trend reversal. The Williams %R indicator is choppy by nature and can easily reverse after crossing below extremes which is why it is important to wait for the new trend to develop.
A recent HingeFire screen found that DRIV (Digital River Inc)
 has just crossed below the 80 level exiting the oversold condition. Correlation with other indicators may indicate that the new trend of increasing prices rising is likely to remain in place for several weeks.
Crossing out of overbought
Another trend reversal scenario occurs when the Williams %R indicator crossed above the 20 level indicating the stock is no longer overbought. Correlation with other technical indicators often indicates opportunities where the price is likely to continue to drop in price over a several week period. This can enable investors to time solid entry points at short term troughs in price or look at shorting scenarios.
FUQI (Fuqi International Inc.)
 held its IPO in November. Since this time the stock has traded in a range of $6 to $11.50. Recently the Williams %R crossed above the 20 threshold exiting the overbought condition. Since this time the price of the stock has dropped by more then two dollars.
Williams Summary
Williams is similar to the stochastic indicator, however the 14 days Williams %R tends to be more choppy. This leads at times to false signals regarding trend reversals and breakouts; on the positive side the Williams indicator tends to be quick and does not lag greatly. This all gets back to a regular theoretical discussion regarding signal quality versus speed. Overall, it is important to use other technical indicators to confirm the action in the Williams %R before performing transactions.
Many investors use a 28 day version of Williams %R in charts for a smoother version with less false alerts.
The HingeFire tool supports users in screening for the following essential situations with the Williams %R Indicator:
- Crossing into oversold – Williams crossing above 80.
- Crossing into overbought – Williams crossing below 20.
- Crossing out of oversold – Williams crossing below 80.
- Crossing out of overbought – Williams crossing above 20.
Combining indicators such as the Williams %R Index with other technical indicators enables investors to properly time entrance and exit opportunities in the market. The Williams Indicator support in the HingeFire Stock Screener combined with other fundamental and technical criteria provides a powerful tool to uncover prospects that can enhance your portfolio.
Monday, December 10, 2007
The National “Rah-Rah” Association is at it again
While the rest of the nation is facing the cold, harsh reality of the housing downturn, the NAR (National Associations of Realtors) is back in hype mode while trying support their membership. The trade group lifted its outlook for 2008 home sales and insisted the market is stabilizing. In fact its outlook for housing in 2008 suddenly appears to be outright rosy considering the current carnage.
Most other market analysts are not buying the NAR perspective however. “Numerous other economists, however, are far less optimistic than the trade group. They predict weak sales and falling prices through next year and beyond and emphasize that those problems could worsen if the economy sinks into a recession.”
The reality is that the U.S. is at least 18 months away from a housing recovery. Both home prices and sales will slide significantly in 2008 according to most economists that evaluate the sector. It will take more than NAR’s rose-tinted glasses to drag the housing market out of the abyss.
Realtors' Forecast Bucks Common Wisdom (not to mention common sense)
http://biz.yahoo.com/ap/071210/housing_forecast_realtors.html
Quick Takes: UBS
UBS landed at the top of the financial news today revealing a $10B write-down and an emergency injection of cash from sovereign wealth funds. The Government of Singapore Investment Corp and a group in the Middle East are providing a total of $11.5B in fresh capital.
The situation mirrors what was seen at Citi except that UBS went one step further in eliminating their cash dividend for 2007 and replacing it with a stock dividend. Overall this is a lousy deal for the common shareholders in that both their stock is being diluted and more UBS equity is being effectively relegated to the preferred shares column. However it is easy to counter that the common shares would be near worthless if the bank was not able to maintain their capital ratios or was forced to merge for pennies on the dollar (or centimes on the franc). Overall the market took the deal as good news driving UBS shares up nearly 2%.
During the upcoming weeks there is an increasing expectation that more major banks will follow the lead of Citi and UBS. The market can expect to see bailouts from sovereign funds, cuts in cash dividends, dilution of common shares, and further mind-numbing write-downs.
UBS to Sell Stakes After $10 Billion in Writedowns
http://www.bloomberg.com/apps/news?pid=20601087&sid=auWIldY77wRU&refer=home
Friday, December 7, 2007
The Mortgage Plan
The administration rolled out its mortgage initiative late this week. The plan will help 340,000 mortgage holders whose teaser rates are due to reset. Another 60,000 sub-prime customer are already so far behind on payments that they will not qualify for the plan. The standards for inclusions in the plan require that “the loan must have been originated between January 1, 2005 and July 31, 2007 when underwriting standards were at their worst. They must also have been made for at least 97 percent the value of the home, and the borrower cannot be more than 30 days delinquent.” The rate freeze scheme would lock in the initial teaser rates for a period of five years, avoiding payment increases for homeowners.
With an estimated 1.4 million homeowners expected to enter foreclosure in 2008, any plan that will possibly enable nearly a quarter of the houses to escape the situation is likely to be received positively on Wall Street. Reducing the number of foreclosures by 25% clearly reduces the stress on mortgage-backed derivative debt.
However the immediate upbeat reaction ignores the reality that the bulk of outstanding mortgages are still likely to flounder. A report released today shows that mortgage delinquencies have risen to a 20 year high. One in five adjustable-rate sub-prime loans had late payments in the quarter. The deterioration of the housing situation is accelerating. The U.S. is likely to establish new standards for peaks in foreclosures, crests that even exceed those in the 1930s.
U.S. Mortgage Delinquencies Rise to 20-Year High
http://www.bloomberg.com/apps/news?pid=20601087&sid=aNNNcUnDqS_g&refer=worldwide
Subprime plan seen reaching 340,000
http://www.reuters.com/article/ousiv/idUSN0731666420071207
Come take the Poll
A good number of people receive HingeFire via RSS or email. A new feature has been added to the blog homepage - The Market Poll
Every month a different poll will be posted on the top left of the blog. The current question is:
Will the market go up or down before Jan 1st?
Come drop by the blog at http://hingefire.blogspot.com and take the poll.
Every month a different poll will be posted on the top left of the blog. The current question is:
Will the market go up or down before Jan 1st?
Come drop by the blog at http://hingefire.blogspot.com and take the poll.
Thursday, December 6, 2007
Will State SIV Funds bankrupt local communities?
Many states are hiding a deep dark secret; they have been running investment funds that have bet heavily on mortgage-backed derivatives. Hiding behind financial confidentiality; many government officials loath to discuss the impending crisis. Significant portions of the money placed in these state funds comes from local governments who have been urged to allocate money in these vehicles in order to earn higher returns. Now the wheels are coming off.
The recent situation in Florida is a standard run on the “bank”. Very jittery local governments basically rushed the gate to remove money from the state fund over several days until officials shut down withdrawals on January 29th. Today the fund re-opened up to limited withdrawals of up to 13% of assets limited to $2 million. Action was described as brisk as many communities sought to recover something from the pending fiasco.
The local governments have every right to be nervous; currently many of these state funds are probably only worth only 30% of their “face-value”, as a continual cycle of downgrades hit their mortgage-backed SIV investments. Many local communities rely on these funds to pay pensions and operating expenses. A crisis in these state funds would leave many government retirees out in the cold and communities unable to meet payroll.
States such as Connecticut, Maine and Montana are experiencing similar scenarios with local governments rushing the gate for withdrawals, the quarantining of troubled fund components, and more than 20% of some funds being declared as defaulted SIV investments. The state government officials have moved to the defensive in recent days making statements that they expect the funds to “recover” and that state reserve funds can cover any contingent shortfalls.
So much for proper stewardship, most of these vehicles were sold to the state financial oversight boards as “safe” investments that would earn higher interest. Of course, Wall Street reaped exceptional fees for their involvement in these entities while hiding the actual risk involved from these government entities.
At this point, it is simply a question of how deep and painful the fallout for local governments will be rather then a question of if the downside SIV scenario will occur.
Reference:
Fund Crisis in Florida Worrisome to States
http://www.nytimes.com/2007/12/05/business/05invest.html
Wednesday, December 5, 2007
Learn to Invest in Stocks
For many new investors one of the more frightening aspects of the financial markets is simply figuring out the mechanics of their on-line brokerage account and getting over the fear of performing transactions.
Fortunately for many novices there are resources that can provide some education and help ease them into performing stock transactions. One of the best ways to learn about investing is through paper-trading a simulated account.
There are multiple simulated account resources on-line. One of the best is Wall Street Survivor. This contest site provides a simulated brokerage account with all the features that you will find in your real account. Contests are run that last ten weeks with prizes rewarded for the best returns. There is an active community where you can learn including bulletin boards and blogs. Even if your intent is not to place first in the contest, this is an excellent environment to learn the basics of stock investing and try simulated trades before going up to bat “for real”.
For experienced investors, the contests (with cash prizes) are enlightening and educational. Wall Street Survivor is a valuable resource for investors at all levels of experience. Check them out at: FREE TO PLAY - Fantasy Stock Trading Challenge
Tuesday, December 4, 2007
Screening to Win: MFI (Money Flow Index)
The overview below describes one of the common technical indicators – MFI and provides insights on how to utilize it in your stock selection. Hopefully this outline will provide traditional fundamental investors with some solid insight on how to incorporate technical indicators into their screening. The free HingeFire Stock Screener which can be found at http://www.hingefire.com is one of the few tools available that includes a wide selection of fundamental and technical criteria for selecting stocks. Using a combination of fundamental and technical screening is a powerful tool for winning in the market.
MFI
Money Flow Index Overview
The Money Flow Index is a momentum indicator utilizing volume that provides a sense of the money flowing in to and out of a security. MFI is created using a fourteen day period and compares the flow of money into a stock (positive flow) to the money flowing out of a stock (negative flow). Each day the average of close, low, and high is calculated and compared to the previous day. On days this average price exceeds the previous day is viewed as positive volume, on days below as negative volume. The positive and negative volume totaled over the 14 day period to create the MFI indicator.
Utilizing a scale of 0 to 100, the Money Flow Index is similar to other momentum oscillators. However MFI augments the underlying pricing information with a volume flow component when forming the oscillator.
The HingeFire tool provides support to incorporate the Money Flow Indicator in your creation of screens for stocks. Users can scan to determine if the MFI indicator is greater than or less than the key 20 and 80 levels, and also establish if the MFI value has just crossed above (JCA) or below (JCB) these thresholds.
How to use MFI in screening
Many investors utilize the Money Flow Index to identify oversold and overbought conditions. MFI levels below 20 are generally considered oversold and those above 80 are considered overbought. However MFI can remain at these levels for lengthy periods of time.
MFI provides solid insight into medium term trends. Investors normally use the Money Flow Index to time transactions or to filter stocks to exclude.
Overbought Territory
Stocks with MFI levels above 80 are considered over bought. Note that a number of these stocks may continue to rise in price and exhibit high MFI readings for a period of time. Most of these stocks are due for a tumble however as they approach an exhaustion level of available purchasers in the market. A number of traders screen for high MFI levels and then continually review the charts over a period of days for possible short candidates.
The MFI for MXM (MAXXAM Inc.) crossed above 80 about 3 weeks ago and has remained at this level. A screen with the HingeFire tool found this as one of the many stocks with an MFI level greater then 80. Pulling up a recent chart for MXM demonstrates that the MFI is likely losing strength and will shortly cross below 80 shortly.
Oversold Territory
Stocks with an MFI below 20 are considered to be oversold. Some oversold stocks are due for a bounce back. Others have negative fundamental and trend information associated with them and may continue to dive in price with solid volume for extended periods of time.. A number of investors screen for stocks with low MFI levels and then sort through the results looking for value candidates at appealing prices. This is a form of searching for recently created value in the market, taking advantage of short term mis-pricing. At times a sector or individual stock is punished by the market pushing it down with volume to levels of attractive valuation. The MFI technical indicator can be used to screen for these situations.
BVF (Biovail Corp.) recently endured a down trend with high volume and is below the 20 MFI level. An investor can research (or screen) the fundamental attributes of this stock such as P/E and see if it appears to be a solid value play now that the price has dropped to lower levels.
Break below Overbought
One common use for MFI is to screen for stocks that have just crossed below (JCB) the overbought condition at the 80 level. This normally serves as notice that the stock may continue to fall in price over the upcoming few weeks. Normally when MFI crosses below this level, the buyers have stepped away from the stock and upside volume is no longer present.
The MFI for MIDD (Middleby Corp.) just crossed below the 80 level. This is one of the examples found in a recent screen using HingeFire for stocks that JCB (just crossed below) the 80 level for MFI. This is normally a sign that buying may be exhausted and the price will retreat for a period of time.
Break above Oversold
One of the most common uses for MFI is to scan for stocks that just broke above the oversold condition and now should continue to rise in price. A breakout above 20 indicates a solid change in momentum for a stock as it exits an oversold condition as the downside volume is reduced.
RRD (RR Donnelley & Sons Co.) recently experienced a spree of selling with an associated drop in price over the past several weeks. The MFI just crossed above the 20 level which is a strong indicator that the selling volume is reduced and the stock has potential upside.
MFI
Money Flow Index Overview
The Money Flow Index is a momentum indicator utilizing volume that provides a sense of the money flowing in to and out of a security. MFI is created using a fourteen day period and compares the flow of money into a stock (positive flow) to the money flowing out of a stock (negative flow). Each day the average of close, low, and high is calculated and compared to the previous day. On days this average price exceeds the previous day is viewed as positive volume, on days below as negative volume. The positive and negative volume totaled over the 14 day period to create the MFI indicator.
Utilizing a scale of 0 to 100, the Money Flow Index is similar to other momentum oscillators. However MFI augments the underlying pricing information with a volume flow component when forming the oscillator.
The HingeFire tool provides
 support to incorporate the Money Flow Indicator in your creation of screens for stocks. Users can scan to determine if the MFI indicator is greater than or less than the key 20 and 80 levels, and also establish if the MFI value has just crossed above (JCA) or below (JCB) these thresholds.
How to use MFI in screening
Many investors utilize the Money Flow Index to identify oversold and overbought conditions. MFI levels below 20 are generally considered oversold and those above 80 are considered overbought. However MFI can remain at these levels for lengthy periods of time.
MFI provides solid insight into medium term trends. Investors normally use the Money Flow Index to time transactions or to filter stocks to exclude.
Overbought Territory
Stocks with MFI levels above 80 are considered over bought. Note that a number of these stocks may continue to rise in price and exhibit high MFI readings for a period of time. Most of these stocks are due for a tumble however as they approach an exhaustion level of available purchasers in the market. A number of traders screen for high MFI levels and then continually review the charts over a period of days for possible short candidates.
The MFI for MXM (MAXXAM Inc.) crossed
 above 80 about 3 weeks ago and has remained at this level. A screen with the HingeFire tool found this as one of the many stocks with an MFI level greater then 80. Pulling up a recent chart for MXM demonstrates that the MFI is likely losing strength and will shortly cross below 80 shortly.
Oversold Territory
Stocks with an MFI below 20 are considered to be oversold. Some oversold stocks are due for a bounce back. Others have negative fundamental and trend information associated with them and may continue to dive in price with solid volume for extended periods of time.. A number of investors screen for stocks with low MFI levels and then sort through the results looking for value candidates at appealing prices. This is a form of searching for recently created value in the market, taking advantage of short term mis-pricing. At times a sector or individual stock is punished by the market pushing it down with volume to levels of attractive valuation. The MFI technical indicator can be used to screen for these situations.
BVF (Biovail Corp.)
 recently endured a down trend with high volume and is below the 20 MFI level. An investor can research (or screen) the fundamental attributes of this stock such as P/E and see if it appears to be a solid value play now that the price has dropped to lower levels.
Break below Overbought
One common use for MFI is to screen for stocks that have just crossed below (JCB) the overbought condition at the 80 level. This normally serves as notice that the stock may continue to fall in price over the upcoming few weeks. Normally when MFI crosses below this level, the buyers have stepped away from the stock and upside volume is no longer present.
The MFI for MIDD (Middleby Corp.) just
 crossed below the 80 level. This is one of the examples found in a recent screen using HingeFire for stocks that JCB (just crossed below) the 80 level for MFI. This is normally a sign that buying may be exhausted and the price will retreat for a period of time.
Break above Oversold
One of the most common uses for MFI is to scan for stocks that just broke above the oversold condition and now should continue to rise in price. A breakout above 20 indicates a solid change in momentum for a stock as it exits an oversold condition as the downside volume is reduced.
RRD (RR Donnelley & Sons Co.)
 recently experienced a spree of selling with an associated drop in price over the past several weeks. The MFI just crossed above the 20 level which is a strong indicator that the selling volume is reduced and the stock has potential upside.
MFI Summary
Money Flow Index bears some similarities to RSI. However the Money Flow index utilizes volume in the calculation, providing an enhanced awareness of the size of fear and greed in the market.
A number of investors look at Money Flow Index on charts to scrutinize for divergences between MFI and the price trend of the stock. However the most common utilization of MFI is screening for oversold and overbought levels as outlined above.
Many investors focused on volume-driven technicals use the HingeFire tool to screen for the following situations with the Money Flow Index:
- Overbought Territory – Screening for stocks with RSI levels above 80.
- Oversold Territory – Screening for stocks with RSI levels below 20.
- Break Below Overbought – Screening for stocks that JCB the 80 level.
- Break Above Oversold – Screening for stocks that JCA the 20 level.
Combining technical indicators such as Money Flow Index with commonly used fundamental criteria when selecting your investments helps put the market edge in your corner. The MFI support in the HingeFire Stock Screener adds a powerful tool for searching for volume-related extremes that will improve the timing of your market transactions.
Monday, December 3, 2007
Investors Business Daily – This is Free Pass Week
Just a note, December 3rd through 9th is free pass week at Investors Business Daily (http://www.investors.com/). I personally find IBD to be a valuable resource; this is an opportunity for everyone to check out what they offer at no cost. During this time, you can check out some of their key financial material including:

- eIBD - the electronic edition of Investor's Business Daily.
- Top-Rated Stocks Under $10.
- IBD 100 Top-Rated Stocks (An excellent resource)!
- Research leading and emerging companies with eTables.
- Use IBD Stock Checkup to Diagnose the health of your stocks with IBD Stock Checkup.
- Use Screen of the Day and Daily Stock Analysis to find new investing ideas.
I would urge folks to take advantage of the free pass week to check out IBD!
Get 4 Bonus Weeks when you subscribe to Investor’s Business Daily Digital Edition!Sound the Alarm: Corporate Profits Rollover and Dive
Corporate profits are tumbling across all sectors. The overall profits fell at an annual rate of $19.3 billion in the third quarter driven by a drop in domestic earnings of $41.2 billion. While international profits remain strong, most of this increase is driven by the fall of the dollar against other currencies rather than any true operational earnings enhancement.
Profits for the large firms included in the Standard & Poor's 500 index fell almost 25 percent in the third quarter. The fourth quarter is not expected to provide any improvement; projections have the profits dropping an additional 30%. While the bulk of the drop may be associated with write-downs in the financial sector, the drop to some degree is being observed across all sectors. No sector is immune; chemical, manufacturing, technology, transport, retail, and every other industry has felt the impact of rising fuel costs, spending slow-downs, declining credit availability, and other troublesome factors.
Early in 2007, analysts has expected an increase of over 15% in operating profits; a month ago this figure sat at 8.8% and now this figure has been scaled back to a mere 1.1%.
The rollover of U.S corporate profits, to a scenario of significant declines, increases the likelihood of a recession. It is one of the collective headwinds applying the brakes to both the market and broader economy.
Recession Hits U.S. Profits; Economy Might Be Next
http://www.bloomberg.com/apps/news?pid=20601087&sid=aZi6pAy35zW4&refer=home
“The earnings recession has already arrived,'' says David Rosenberg, North America economist for Merrill Lynch & Co. in New York. ``We are going to see an economic recession in '08.''
Reference:
A post from mid-October outlined the increasing headwinds facing the economy – the risk of “Lower earnings and increased warnings” was outlined near the top.
Increasing Risk: Headwinds
http://hingefire.blogspot.com/2007/10/increasing-risk-headwinds.html
Another post from early August out lined the economic scenarios relative to credit and some associated investing thoughts.
Credit Crunch – Increasing Risk
http://hingefire.blogspot.com/2007/08/credit-crunch-increasing-risk.html
The Ten Worse Housing Markets
Courtesy of BusinessWeek…. Take a look at Slide 10
San Francisco
25.1% - Expected housing price decline by November 11, 2008.
Not a pretty picture!
http://images.businessweek.com/ss/07/10/1030_realestate_markets/index_01.htm?campaign_id=yhoo
San Francisco
25.1% - Expected housing price decline by November 11, 2008.
Not a pretty picture!
http://images.businessweek.com/ss/07/10/1030_realestate_markets/index_01.htm?campaign_id=yhoo
Is Northeast Real Estate recovering?
Recent figures released by National Association of Realtors (NAR) show prices in the Northeast rose 1.3% compared to a year ago. The Northeast entered the real estate decline before most other areas of the country and may be on the leading edge of the cycle out.
However the expectation that the Northeast will continue this recovery may simply be wishful thinking. Home sales are still declining, inventories increasing, and other economic factors such as the mortgage credit crunch are likely to inflict further damage. The uptick seen in the NAR survey may be a temporary blip in the larger picture for the region.
Northeast Home Prices Remain Strong
http://biz.yahoo.com/bizwk/071129/nov2007db20071128562540.html?.v=1&.pf=real-estate
"It is looking a little less dark in the Northeast than in the rest of the country," Chen says. "But I don't expect housing activity to pick up substantially in the Northeast in the next six months. There's going to be further correction in terms of sales falling and prices declining. A lot of these markets, such as Boston and New York, are still overpriced, overvalued, and do have excess inventory."
Where Real Estate is Hot
The good news is – There are still hot real estate markets you can find where prices are expected to rise for the next ten years.
The bad news – You will need to move to the Middle East to take advantage of them.
Real estate sector 'to see continuous growth'
http://www.gulf-daily-news.com/Story.asp?Article=201457&Sn=BUSI&IssueID=30255
"The demand for real estate in the Gulf is increasing as foreign investment is becoming more popular due to the sub-prime crisis in the US," Century 21 Bahrain real estate professional Hind Yassine told the GDN.
Sunday, December 2, 2007
The Mortgage Bailout: Moral Hazard
The federal government is working with the financial industry to hammer out a proposal to temporarily freeze interest rates on troubled sub-prime and adjustable rate mortgages. Treasury Secretary Henry Paulson is scheduled to reveal the details of the plan at a national housing conference on Monday,
The major thrust of the proposal would be for lenders to extend for a number of years the lower, introductory teaser rates that were offered on subprime mortgages. Initial details suggest an extension of the lock period to seven years.
Over 2 million of those initial "teaser" rates are scheduled to rise to much higher levels by the end of next year. Many homeowners will not be able to meet the higher payments, likely triggering hundreds of thousands of defaults. Naturally this would dump more unsold homes on an already suffering housing market, pushing home prices down further, further jolting consumer confidence and increasing the probability of a full-blown recession.
Most of the hue and cry in the press recently focuses on the moral hazard of saving homeowners who made very bad choices, few articles focus on the absurdity of bailing out irresponsible banks.
Mortgage aid plan sparks hope and resentment
http://news.yahoo.com/s/nm/20071130/us_nm/usa_housing_hazard_dc
"It's not the government's job to bail them out."
"It feeds into the mentality that the next time you screw up, someone will rescue you."
These statements are even more applicable to the banks than to the stressed homeowners. In reality this plans is about saving the bacon of the banks. Since when does the government actually care about individual homeowners, this entire bailout is about salvaging the entire banking system from a crisis. The concept of moral hazard is even more applicable to bailing out these banks.
Some industry specialists such as Peter Schiff, president of Euro Pacific Capital present a more comprehensive perspective. He recently stated, "The rhetoric is 'We've got to help homeowners,' but the reality is it's designed to help the fat cats, Wall Street. It's bailing out the lenders."
Many historians view the Great Depression would have lasted a mere two years rather than ten if the government had allowed the implosion of the excesses of the financial system to run their downhill course. The intervention of the government to prop up banks and interfere with market activity caused the dismal economic conditions to linger for many years. Only the intervention of WWII caused a turn-around.
At this point it appears that the bail-out plan in some form is a sure lock. Major players in the mortgage industry such as Citigroup, Wells Fargo & Co. and Countrywide are on board. The holders of the CDO notes may cry about reduced interest payments. However CDO holders such as pension and hedge funds face a stark reality either getting paid nothing at all as the entire stack of derivative dominoes tumble or losing a portion of the interest. Most will gladly grab the horns at this point and accept the reduced payments. It is likely that only the lower tranches will suffer and the higher tranches get paid first, leaving only the holders of the lower quality segment of the mortgage derivatives out in the cold.
Maybe this time, the U.S. should simply allow the excesses to be washed out of the financial system. The pain, however sharp, will last for a shorter period of time then a continually cycle of bailouts. Wall Street has a long history of ignoring risks in order to make a quick buck; this leads to constant repetitious cycle of poor financial management. The game ends the same each time; with individuals left out in the cold, the financial firms propped up, bankers flashing big bonuses while every taxpayer is zinged, and another cycle of unnecessary government intervention. Is it time to steer a new course?
Reference:
An earlier post discusses the moral hazard of bailing out Citi
Should Citi Pay for its Mistakes
http://hingefire.blogspot.com/2007/10/should-citi-pay-for-its-mistakes.html
Subscribe to:
Posts (Atom)